The Young Consultant · Client engagement · 2024

plenti.

Finding the market for adaptable living.

On a seven-person consulting team, I helped turn an early-stage startup’s broad UK expansion question into a clearer story about customers, pricing, and research quality.

Final client presentation Download PDF  ↓
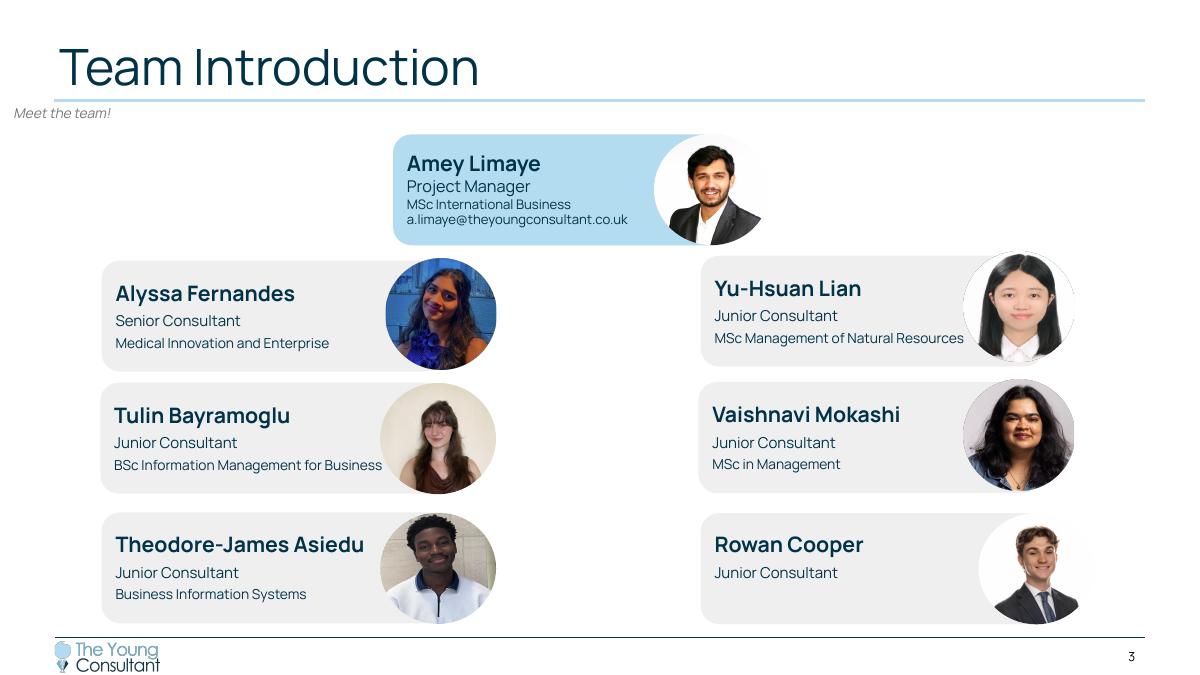
Team introduction slide showing the seven-person Plenti Space consulting team
3 / 29Team introduction

Scroll sideways, swipe, or use the arrows

RoleJunior Consultant
Team7 consultants
FocusSurvey · market · SQL
TimelineOct 2024—Jan 2025

01 / Survey redesign

Before

How the initial survey worked.

Original 96-response baseline

Question 01 What is your age?
Question 02 Where do you live?
Question 03 What housing accommodation do you have?
Housing tenure n=22 Owner
Owner question Would you prefer smart walls?
Yes50%
No50%
Housing tenure n=74 Renter
Renter question Would you prefer smart walls?
Yes74%
No26%
96Total responses
74Renter responses
22Owner responses

74%renters

50%owners

preferred smart walls

Preference percentages are reported directly in the final presentation. The “No” percentages are their complements.

After

The second survey added more branches to capture how different people valued smart walls.

Excel could still store every response, but the growing number of conditional paths made a flat export difficult to navigate. A separate question-and-rule map would make each route easier to reconstruct, filter, and verify.

Illustrative model405responses

This 405-response scenario models how the redesigned survey could branch at scale. Every card shows the modeled count reaching that option; only the leading card continues so the route remains readable.

Question 01What is your age?
405modeled responses
Question 02Where do you live?
128continued from 25–34
Question 03What is your current accommodation?
7 accommodation types
46continued from London
Question 04Do you rent or own your home?
R · renterO · ownerF · family / other
14continued from studio
Question 05Would you prefer smart walls?
Y · yesM · maybeN · no
11continued from renter
Question 06What is fair for the same-size smart-wall space?
Modeled rent values
7continued from yes
Question 07What is fair for the smaller smart-wall space?
Modeled rent values
3continued from £1,400

Card number responses reaching that option Blue outline branch continued into the next question Curved line observed transition

Modeled counts are illustrative. They preserve the original survey’s category structure while adding routes introduced by the redesign; they are not reported study results.

02 / Working data product

SQLite market tool

Exploring the market evidence.

The survey supplied the customer questions. This working extension joins official population, household, rent, and house-price indicators by region so the evidence can be filtered, compared, and inspected without rebuilding a spreadsheet for every question.

Official sourcesSQLite keysRegional profilesInteractive screen
One geography keyEvery regional measure connects through the same ONS geography code.
Multiple dated indicatorsPopulation, households, rents, and prices retain their source periods.
Auditable SQLThe interface can reveal the exact query behind the ranking.
plenti_market_lab.sqlite
integrity: ok

Current market screen

Where does space pressure look strongest?

As of 01 Sep 2026

Loading verified SQLite output…

View the SQL behind this ranking
SELECT … FROM v_market_pressure;

Illustrative prioritisation hypothesis—not a demand forecast. Change the metric to inspect the evidence without the composite score.

SQL lab  →