74 renters + 22 owners
The Young Consultant · client work + independent extension
plenti.
From survey answers to a queryable market model.
I rebuilt a 2024 client survey into a relational SQLite system, then joined it to current regional population, household, rent, and house-price evidence to create a market-screening tool that can be audited—not just presented.
95visible survey rows
9English regions
4current official sources
SQLitePython-built database
Data-quality catch The final deck says 96 responses. Its underlying raster contains 95. The database preserves both instead of smoothing the mismatch away.
Current market screen
Where does space pressure look strongest?
Loading verified SQLite output…
Selected region—
Research screen—
Monthly rent—
Age 18–34—
Shared-adult households—
House price—
View the SQL behind this ranking
SELECT … FROM v_market_pressure;Illustrative prioritisation hypothesis—not a demand forecast. Change the metric to inspect the evidence without the composite score.
Original roleJunior Consultant
ExtensionSQL · Python · data QA
Market grain9 English regions
Fresh-data rule01 Sep 2024+
01 / The honest SQL advantage
SQL was not needed for one 95-row raster. It was needed for the system around it.
Excel is still the fastest place to inspect one export. Qualtrics is still the place to collect answers. SQL earns its keep when different grains—respondents, questions, routes, regions, dates, sources, and market indicators—must remain related without copy-paste joins.
| Need | Excel | Qualtrics | SQLite |
|---|---|---|---|
| Review one survey export | Best fitFast pivots and spot checks | Export source | Unnecessary alone |
| Collect conditional answers | Awkward | Best fitFielding and display logic | Stores a versioned logic map |
| Join survey + geography + monthly market data | Possible, fragile | Not its job | Best fitKeys, constraints, time-aware joins |
| Trace every number to a source period and workbook cell | Manual discipline | Survey only | Built inProvenance on every observation |
02 / Historical survey evidence
The database starts by auditing the source, not trusting the slide.
The client survey remains useful as directional evidence, but its fieldwork date, sampling frame, weighting, and raw platform export are absent. The public build therefore stores every defensible aggregate with its denominator and keeps respondent-level tables empty.
73 renters + 22 owners
SQL quality check1 unexplained row
Kept visible; never imputed.
Renter segmentn=73 traceable
74%preferred smart walls
£1,668average monthly rent
+3%same-size premium
+0.57%smaller-space change
54 of 73 visible renter rows answer “Yes,” which resolves to 74.0% even though the deck labels the segment n=74.
Owner segmentn=22
50%preferred smart walls
£536,682average property price
+5%same-size premium
−6.5%smaller-space change
The preference split is exact: 11 “Yes” and 11 “No.” The printed room-type percentages do not perfectly match the underlying counts.
Queryable relationship
Housing type × tenure
Counts from all 95 visible raster rows.
What this survey cannot say
There is no student-status, university, named house, postcode, household ID, income, or floor-area field. The database can relate age bands, regions, housing types, tenure, preferences, and price scenarios—but it does not invent “which students live in which houses.”
03 / SQL notebook
Five real queries, with their actual SQLite results.
The browser loads a JSON export generated by the database build. Each tab shows the exact read-only SQL and returned rows, so the interaction remains fast on mobile while the downloadable SQLite file remains the source of truth.
Loading query…Download .sql
SELECT …Result set—
04 / Relational design
Different grains stay separate until a key joins them.
A region is not a respondent. A housing type is not a household. A recent source is not the same as a recently downloaded file. The schema makes those boundaries explicit.
Sources5 pinned XLSX + reviewed PDF facts
→
Pythonextract + hash + validate
→
SQLitekeys + constraints + views
→
Websiteverified query output
Current market
source_datasetone source edition6 rows
→
source_filehash-pinned workbook5 rows
→
observation_lineagesheet + cell + transform—
geographyONS area code11 rows
→
area_observationarea × metric × period—
←
indicatormeasure + unit17 measures
Survey evidence
survey_wavereported n + visible n1 wave
→
survey_wave_sourcesource + evidence role3 rows
→
source_datasetdeck / raster provenance
survey_segmentall / renter / owner3 segments
→
survey_observationsegment × metric × category—
←
survey_metricmeasure + unit
Versioned questionnaire
survey_versionfielded / redesign
→
question11 deck + 1 screener12 rows
→
routing_rulejoined condition + next step12 rules
Respondent-ready, intentionally empty
respondentde-identified response0 public rows
→
housing_profiletenure + dwelling
+
responsequestion × answer
05 / Fresh market evidence
No 2021 Census values hiding under a 2026 label.
The Census is valuable, but its March 2021 reference date breaks this project’s two-year rule. Five hash-pinned workbooks now feed the model, and 162 lineage rows preserve the exact sheet, cell or range, and transformation behind all 153 official observations.
ONS · accredited official statisticsPopulation estimates: mid-2025
Single-year ages, regional population, density, and median age.
Reference: 30 Jun 2025 · Released: 29 Jul 2026 ONS · Labour Force SurveyFamilies and households: 2025Household size and two-or-more-unrelated-adult households by region.
Reference: Apr–Jun 2025 · Released: 17 Apr 2026 ONS · provisional latest monthsPrivate rents: July 2026Overall, one-bed, two-bed, and flat rents with annual change.
Reference: Jul 2026 · Released: 19 Aug 2026 ONS + HM Land RegistryUK House Price Index: June 2026Regional average prices and annual change.
Reference: Jun 2026 · Released: 19 Aug 202606 / Original client engagement
The database extends the work; it does not rewrite who did what.
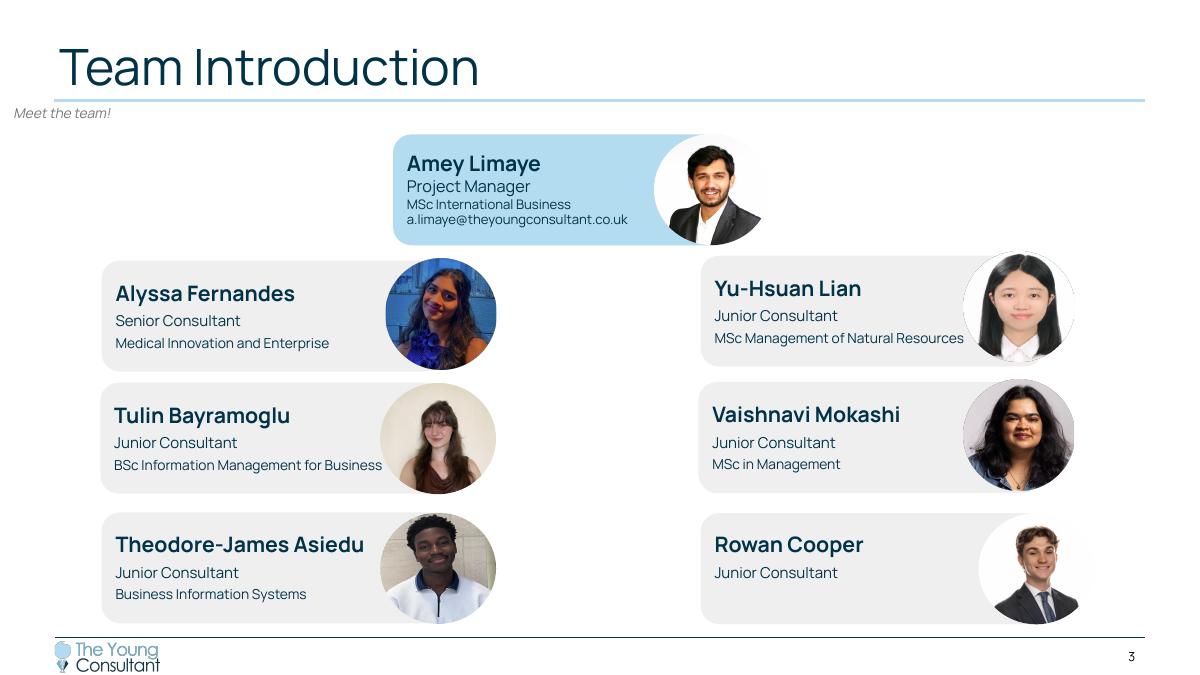
In 2024, I worked on a seven-person team covering survey analysis, pricing questions, market framing, sustainability, suppliers, and regulation. The SQLite/Python market lab is a later independent portfolio extension built from those artifacts.
3 / 29Team introduction
Swipe or use the arrows
07 / Reproducible artifacts
Open the work, not just the story.
The public package includes the database, raw ONS workbooks, hash-verifying extractor, cell-lineage map, schema, query library, data dictionary, methodology, and original presentation.
SQLiteWorking databaseOpen in DB Browser or the SQLite CLI
SQLSchema + viewsTables, constraints, indexes, and score
PythonBuild pipelineFreshness gate, inserts, integrity check, export
PythonRaw XLSX extractorHash checks, header checks, and exact cell lineage
SQLQuery notebookFive evidence-backed analyses
JSONExtracted values + lineage153 facts mapped back to five source workbooks
DocsData dictionaryTable grain and field meaning
DocsMethodologyScoring, survey reconciliation, limitations
08 / Limits
What this model proves—and what it does not.
It proves
A real relational schema can preserve survey aggregates, branching logic, current regional indicators, source periods, and data-quality checks in one auditable system.
It suggests
London is the clearest first research priority under this weighting because rent, young-adult concentration, density, and unrelated-adult households all score highly.
It does not prove
Regional indicators cause smart-wall demand, the survey is representative, or any score predicts sales. Those claims require new fieldwork and customer-level validation.